


One year ago, Congress defunded public media. Now that we're 100% community funded, please become a sustaining member or increase your existing membership today.
California spends billions based on this pollution tracker. Who benefits from its latest update?

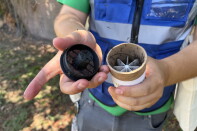
An athlete plays soccer at a public soccer field surrounded by warehouses and smog in Jurupa Valley.
(
Elisa Ferrari
/
CalMatters
)
California is again updating the system it uses to decide which polluted communities get cleanup funding. The tool, CalEnviroScreen, has already steered billions of dollars to the state’s most burdened neighborhoods, but critics say it still overlooks some of them.
The update is reigniting a long-smoldering debate: officials promise they're listening to communities more than ever, while advocates say the state's data gaps leave some areas invisible to the system designed to help them.
What’s new
Officials at the Office of Environmental Health Hazard Assessment, the state agency managing the tool, said they worked with eight community organizations to design this fifth update – including the Environmental Health Coalition, UNIDOS Network and Comite Civico del Valle. The update adds two indicators: diabetes prevalence, because people with diabetes are more vulnerable to air pollution; and small air toxic sites, to track additional risks from sources like urban oil wells and dry cleaners.
EnviroScreen also incorporates data improvements among some of the 21 other indicators it uses, such as adding children’s blood lead levels to a risk assessment for lead exposure from housing. The state will hold virtual and in-person public meetings this month to gather feedback; officials said they expect to publish a final version in the summer.
“We listen to stakeholders, community groups, academics, government agencies to understand any new layers that might be needed to better characterize both the pollution burden and the population vulnerability,” said Álvaro Alvarado, the environmental agency’s supervising toxicologist. “It's a constant work in progress.”
State law requires at least 25% of California's cap-and-invest funds — money raised through greenhouse gas auctions — go to the most disadvantaged communities. Since 2014, the state has used CalEnviroScreen to define them, including the top 25% of census tracts in that definition.
Sponsored message
-
 Populations of two disease-carrying mosquito species are concerning public health officials, who are employing new strategies to reduce their populations.
 -
 The inaugural event kicks off Friday, July 24. The crawl includes stores from Pasadena to Santa Monica, from Montrose to Manhattan Beach.
 -
 Recent rulings have struck down requirements in L.A. and Pasadena for landlords to pay thousands of dollars to tenants who couldn’t afford large rent hikes.


Laura August, the agency’s environmental program manager, said the update does not dramatically shift the census tracts identified as among the most polluted. She said the Bay Area and Central Valley decreased in the ranking slightly. About 80% of communities designated as disadvantaged remain unchanged in the new update, she said.
How the tool works and what it’s missing
Disadvantaged communities have received at least $5.8 billion in cap-and-invest funds since 2015.
Environmental advocates said that although the tool is essential and provides important resources, it still leaves out important information. Some critics want to see additional indicators, such as tree canopy coverage and wildfire smoke data.
“It would need to have the kind of ground-truthing work … which is to literally walk the neighborhood and count and calculate all the different polluting sources (and stressors) like heat islands and lack of tree cover and water stress,” said Rebecca Overmyer-Velazquez, a coordinator for the Clean Air Coalition of North Whittier and Avocado Heights.
State environmental officials said they plan to incorporate climate data and data about pollution magnets, like warehouses, in future versions of the tool.
Sponsored message
Questions about the methodology
Beyond what data to include, researchers have also questioned whether the tool's design itself creates blind spots.
In 2024, researchers with Johns Hopkins University found the previous version of the tool, CalEnviroScreen 4.0, was subjective enough that certain communities could be losing out on billions of dollars.
“If you're the model developer, even if you don't feel that you have any personal biases or you're not thinking about it, all those choices that you make when you make the model, you are implicitly deciding who gets funding and who doesn't,” said Benjamin Huynh, an assistant professor at Johns Hopkins Bloomberg School of Public Health.
For example, the current version of CalEnviroScreen includes data about emergency room visits for asthma as an indicator of how sensitive to air pollution people in a particular area are. But some people, including immigrants, are less likely to visit an emergency room than others – or even visit doctors in the first place, to get diagnosed.
August said the agency took researchers’ criticism seriously. Late last year, she and other state scientists defended the tool in a published report, finding that the state’s methods "prioritize generalizability, dissemination, and utilization without sacrificing accuracy."
Advocates want real change
But even with improvements to the data, advocates said the bigger problem is how the tool gets used — or not used.
Sponsored message
CalEnviroScreen was a product, in part, of advocacy from environmental justice leaders in the 1990s. But advocates said they aren’t sure whether the programs funded by the money are actually leading to pollution reduction, and agencies aren’t using the tool aggressively enough in their own policies.

Parents and children join the Lincoln Heights Community Coalition in a rally outside Hillside Elementary School, protesting the development of a warehouse across the street that activists say would harm the health of local residents, in Los Angeles on Nov. 26, 2024.
(
Zaydee Sanchez
/
CalMatters
)
Bradley Angel, director of the environmental group Greenaction for Health and Environmental Justice, faulted the state for not using the tool to deny waste permits to polluters.
“It's great that CalEnviroScreen exists … but when communities and environmental justice groups were advocating for what became CalEnviroScreen, they weren't looking at dollar signs. They were looking to protect our health,” Angel said.
State agencies do use the tool in some policy decisions. The Air Resources Board used EnviroScreen to determine which communities would be a part of its Community Air Protection program, which aims to reduce air pollution.
Under a draft regulation, officials with the Department of Toxic Substances Control said it will use CalEnviroScreen as a proxy for cumulative impacts in permitting decisions. But environmental advocates have called the regulation flawed because those impacts cannot prevent the department from issuing a hazardous waste permit.
“Unfortunately, but not surprisingly, (the department) pays lip service to CalEnviroScreen’s own information,” Angel said.
Sponsored message
Looking to other states
At least one other state proves that more aggressive responses to environmental justice indicators are possible, advocates said.
New Jersey has developed a data tool, influenced by CalEnviroScreen. Two years ago, New Jersey started requiring polluting facilities to use its tool to analyze cumulative impacts of different pollution sources in a community. State regulators must deny permits to facilities that can’t avoid harm to overburdened communities.
“The tool is just a tool,” said Caroline Farrell, director of the Environmental Law and Justice Clinic at Golden Gate University. “You've got to be able to figure out how you want to utilize it in a way that actually changes things on the ground for communities.”
This article was originally published on CalMatters and was republished under the Creative Commons Attribution-NonCommercial-NoDerivatives license.

Senior Vice President News, Editor in Chief


